|
Jean-François
FOURCADIER |
|
|---|
|
Jean-François
FOURCADIER |
|
|---|
| write
to me ! |
© 2000-2004-
J.F. Fourcadier
|
welcome page |
| high speed data | television | antennas | microwaves | repeaters | miscellaneous |
The Vertical Insertion Test Signals in television
applying to Amateur Television
GeneralThe European analogue television transmission standards are based on a 625 lines image which is organized into two half-images (fields). Not all of the lines are visible on the screen, in particular the first lines of each half-image (field). In commercial and professional broadcasting one uses these available lines to transmit test signals, perfectly defined at their emission point. These "known" signals will make it possible to assess the quality of the received signal, to measure impairements, and to locate the source of them. In commercial television, the test lines are transmitted permanently, independently of the transmitted program.
The equipment which generates the test lines is the Vertical Insertion Test Signal (VITS) generator. It can be placed in any place in the path of the video signal. The VITS generator is configurable. Lines can cross the VITS generator without modification, others are "erased" and recreated in the VITS generator. One can thus characterize a connection from beginning to end as well on a given segment.
The shape of the VITS was the subject of thorough studies and is standardized. The VITS makes it possible to measure the quality of the signal by means of a simple suitably synchronized oscilloscope. There exists in the professional field automatic measurement equipment which permanently observes the VITS and display on a screen the value of the measured parameters.
We will examine only the lines 17, 18, 330 and 331 which are most useful.
Presentation of the VITS, lines 17, 18, 330 and 331
Line 17
(click to enlarge)
After the line synchronization signal, one finds successively on line 17 a chrominance subcarrier pulse, a 10 µs rectangular pulse called " bar pulse ", a round sine square shaped pulse with a 200 ns middle height duration called "2T pulse", a composite pulse called "20T pulse" (the result of adding of a sine square pulse of which the middle height duration is 2 µs and the 4,43 MHz chroma carrier), and finally a staircase signal.
Line 17 is very useful to measure the amplitude of the sync signals and the white level, the linearity and even to evaluate the group delay distortion introduced by the transmission chain.
Line 18
Line 18 is the "multiburst" line. It is made up of a bar of amplitude of 860 mV of duration 4 µs and 6 bursts whose frequencies are successively 0.5 MHz, 1 MHz, 2 MHz, 4 MHz, 4.8 MHz and 5.8 MHz. It is the best VITS to measure the frequency response. Line 330
Line 330
The luminance staircase, modulated by chroma, makes it possible to measure the differential gain and the differential phase.
Line 331
The two chroma bursts of which the amplitudes are different while modulating an average gray signal makes it possible to measure intermodulation chrominance/luminance.
Use
By means of line 17 (see chronogram) one will be able to easily check:
- the amplitude of the sync signals and the white level
- the linearity: each staircase must be of equal height
- the equalization and the group delay distortion by means of the 20T pulse:
The high frequencies have too strong a level:
The high frequencies have too low a level:
With no group delay distorsion, the 20T pulse will have a symmetrical shape. An asymmetry, compared to the vertical line defining the medium of the pulse, reveals a group delay distortion, the more significant the distortion the more dissymmetry is marked.
The group delay grows with frequency :
The group delay decreases with frequency :
Line 18 makes it possible, by means of the frequencies burst, to appreciate very easily and very quickly the video bandwidth.
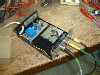
The proposed synchronisation deviceIt is very simple and is built upon an integrated circuit often used to extract line and frame sync signals: the LM 1881 IC. One will find on their odd/even output a signal alternatively high then low, characteristic of each half-image. A resistive divider is inserted to protect the IC from possible shorts. This signal will be presented on the external sync input of an oscilloscope, equipped with a magnifier function or, much better, of an oscilloscope with a delayed time base. By simply setting the scope to trigger on the rising or the falling edge, one will be able to visualize the 17-18 or the 330-331 lines. Don't forget to load the Y input of the scope with a 75 ohms resistance: without it, the measurements are wrong.
To download the documentation of the LM1881 on the National Semiconductor web site: http://www.national.com/ds/LM/LM1881.pdf
Schematics diagram:
(click to enlarge)
(click to enlarge)
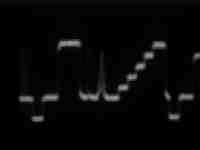
line 17 line 18
(sorry for the quality of the photographs, taken out of B&W but it is better on the oscilloscope!
It will be noted that the 5.8 MHz burst of line 18 doesn't pass through my expensive TV set.....
How to generate VITS?
The ideal is of course to have a VITS generator (they are starting to be in the surplus shops, but they are often expensive).
In the absence of a VITS generator, one will be able to recover a video signal from any good commercial transmission, received for example on a satellite demodulator, and after checking the level and the quality of the VITS, to inject this signal in the transmission chain to be characterized.
Some general ideas to fix the revealed impairments
It is better to correct the possible impairments at the place where they are produced and not to propagate them.
Some hints for the designer:
Once one is sure of their design (design, polarization, operating points of the components...):
- fix problems of level by acting on the gain of the modulators or video ampliers
- fix problems of bandwidth with capacitors and inductors (in the direct path or in negative feedback)
- fix problems of linearity with diodes and resistances, assembled in post or pre-distortion networks
- fix problems with group delay distortion, by special group delay correction cellsBut a misfortune generally never arrives alone and all this is much easier said than done!
The VITS are really handy only for diagnosis purposes. Then, for the most courageous, the tools to be used are the oscilloscope, the LF sinusoidal generator (up to 10 MHz), and if one can unearth one of them, the phasemeter. The method consists of plotting the amplitude-frequency response curves (for the linear distortion), phase-frequency (for the group delay) and amplitude-amplitude (for the nonlinear distortions).
When one has any corrected good, one can expect a better image, colored, even after many microwave links !
Bonnes réalisations !
translation with the friendly help of Philip Hedges
B5+ et 73 de Jean-François Fourcadier, F4DAY
As you can guess, english is not my mother-tongue. If you are living in UK or in the USA or in another english language country, you can help me to improve the quality of my website. Just send me an emailwith the mistakes you have detected (the biggest first ! ). Even one or two corrected sentences will be greatly appreciated. Thank you for your help !
© 2000-2004 J.F. Fourcadier F4DAY